Lesson 5: Living in Internment Camps
Demographics
read charts and maps to learn how and why the distribution of Japanese Canadians changed: a) over time and b) from province to province.
How
- Students study the chart of Japanese Canadian Population Distribution by Province in 1941, 1947 and 1996.
- Students discuss how climate varies with location.
- Students graph the population distribution for 1941-1947 plus 1951 and 1996.
- Use a double line graph. One line shows the Japanese Canadian population for BC. Students graph the Japanese Canadian population for another province (Alberta, Saskatchewan, Manitoba, Ontario, or Quebec).
- Students present and share results.
- Some questions and trends to consider in the class discussion:
- What was the population of Japanese Canadians in BC in 1941? (22,096) in 1947? (6,776)
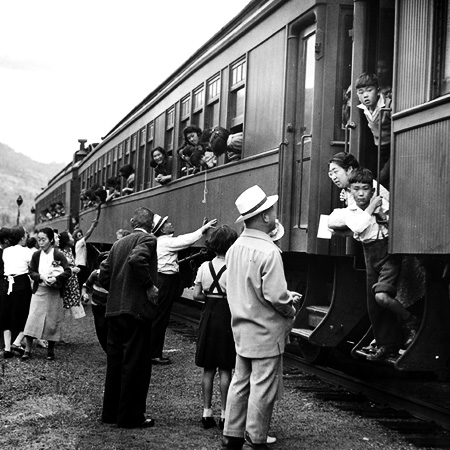
- Why does the population of Japanese Canadians in BC drop dramatically? (racism: 1942 forced removal and in 1945 government's "choice" of move east of the Rockies or be exiled to Japan).
- What do you notice about the population of Japanese Canadians in the other provinces?
- Why is there a change in population in BC in 1996? (restrictions were lifted in 1949 and Japanese Canadians could return to the west coast of BC, arrival of new immigrants from Japan)
- Why do you think so many Japanese immigrants came to BC (instead of the other provinces) at first? (similar climate, job opportunities, proximity to Japan so that they can make return visits)
- Where is the majority of the Japanese Canadian population now?
Assessment
SUGGESTED JOURNAL ENTRY
- Why do the lines on the graph go up and down?
- If you were a Japanese Canadian in 1942 which province would you feel safest in and why?
- If you were a Japanese Canadian child in 1951 where would you choose to live? Why?
